Automotive EMC Testing Case Studies: Radiated and EV Charging Emissions
Automotive EMC · Practical measurement evidence
Radiated emissions and EV charging: three test examples
Three automotive test examples show how detector-specific measurements and emission margins help engineering teams assess vehicle electromagnetic compatibility.
From a test configuration to usable engineering evidence
Automotive EMC testing depends on the operating state, measurement arrangement and applicable detector. Engine-running conditions, energised electronics and battery charging can create different emission patterns. A useful evaluation records these conditions so that engineering teams can interpret the results for the configuration tested.
The examples below draw on numerical measurement tables from work at Stancer Testing-Lab. They cover two radiated-emission assessments and one charging-mode conducted-emission assessment.
Three test examples
Case A
Radiated emissions in two operating states
The reported CISPR 12 program evaluated broadband emissions with the engine running and narrowband emissions with the key on and engine off. Measurements covered the left and right sides over 30 MHz to 1 GHz.
Quasi-peak and average detector results were compared with their corresponding limits. The numerical tables provide a basis for identifying the measurements closest to those limits.
Engineering focus: assessing each operating state with the appropriate detector and limit.
Case B
Comparing multiple measurement positions
A separate CISPR 12 assessment documented left- and right-side measurements for front and rear sections. The program again distinguished engine-running broadband measurements from key-on, engine-off narrowband measurements.
Reviewing the tabulated positions together identifies the smallest recorded headroom for each detector, rather than relying on a single measurement position.
Engineering focus: keeping results traceable to the position and operating condition evaluated.
Case C
Conducted emissions during charging
The charging-mode report references UNECE R10 Revision 6 and includes conducted-emission measurements on the AC mains port. Quasi-peak and average results were recorded against their respective limits.
The smallest calculated tabulated margins were closer to the limits than in the two radiated examples. These measurements provide a practical focus for reviewing the evaluated charging configuration.
Engineering focus: analysing charging-mode interference separately from radiated-emission operating states.
Selected numerical evidence
Measured headroom to the reported limits
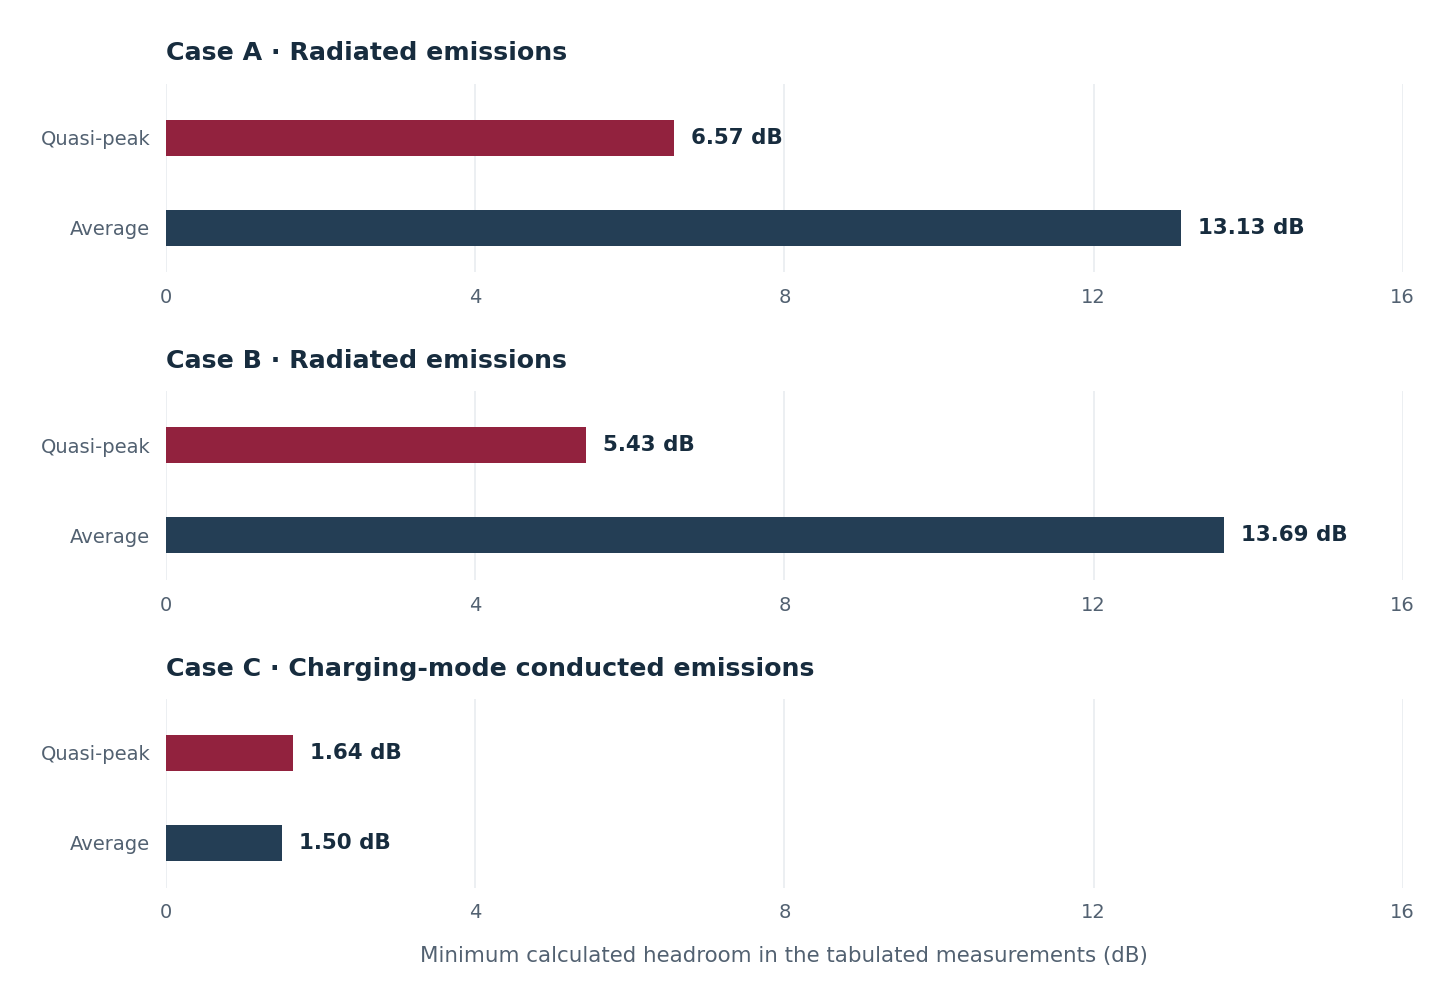
For each example and detector, the chart shows the smallest difference between the limit and measured result across the numerical rows supplied. A positive value means that the tabulated measured level is below its corresponding limit.
| Example | Measurement | Quasi-peak | Average |
|---|---|---|---|
| Case A | Radiated emissions | 6.57 dB | 13.13 dB |
| Case B | Radiated emissions | 5.43 dB | 13.69 dB |
| Case C | Charging-mode conducted emissions | 1.64 dB | 1.50 dB |
How to read these results. The values summarise tabulated measurements, not every point in a complete frequency scan. They do not include an uncertainty adjustment or establish the reports’ formal conformity decisions. They apply to the tested configurations and do not represent full vehicle certification or type approval.
What these examples show
Operating conditions matter. Engine-running, key-on and charging assessments should retain their own configurations and results. A result in one state does not establish the behaviour of another.
Detector-specific results matter. Quasi-peak and average measurements use their corresponding limits. Their numerical margins should be interpreted within the applicable test method.
Small positive margins deserve attention. The charging example includes a minimum calculated average-detector headroom of 1.50 dB. This identifies a measurement worth reviewing alongside uncertainty, setup repeatability and the agreed decision rule; it does not by itself establish the formal conformity outcome.
Preparing an automotive EMC program
- Define the required assessment. Identify the product, applicable standard or customer specification, revision and intended test configurations.
- Prepare the operating states. Document activation procedures, power arrangements, loads and relevant electronic functions.
- Record the measurement setup. Keep positions, connections, detectors and limits traceable to each result.
- Review the evidence. Assess numerical results alongside measurement uncertainty and the agreed conformity decision rule.
Use Stancer’s automotive EMC test preparation checklist to organise the information needed before booking.
Plan your automotive EMC test program
Stancer Testing-Lab supports vehicle and component manufacturers with defined emissions, immunity and electrical disturbance test programs. Share your requirements, operating modes and intended configuration so our team can define the measurements and reporting needed for your project.
Explore automotive EMC testing